Every day, YouTube users view 10 to 20 billion videos and the average adult watches 76 minutes of digital video. By 2019, it’s projected that video will account for 80% of consumer Internet traffic, which is one of the reasons mobile data traffic has grown 400,000,000x since 2000.
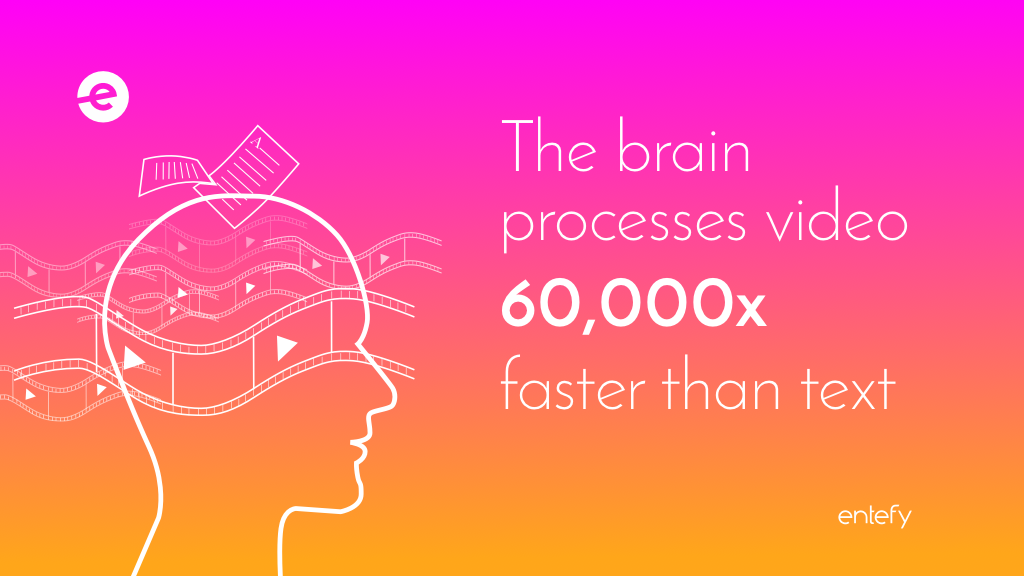
What’s behind the continuing rise of video? For one thing, reading and watching utilize different brain processes. Reading requires active attention and gives the brain a workout because it takes more cognitive effort. Video is passive, easier to consume, and processed by the brain 60,000 times faster than text. Video might win the popular vote, but the many positive effects of reading shouldn’t be dismissed.
Entefy’s enFacts are illuminating nuggets of information about the intersection of communications, artificial intelligence, security and cyber privacy, and the Internet of Things. Have an idea for an enFact? We would love to hear from you.
Since the idea for the company sprang to life on a napkin, we’ve been hard at work developing our ideas and our technology. Today, as Entefy enters its next phase of growth, we’re debuting our new logo, visual style, and exclusive content, all of which can be seen on our new website.
Much has happened since the very early days of Entefy. Big technological breakthroughs. Key product milestones. National user studies. User experience testing. And a long list of amazing individuals—team members, investors, partners, and advisors alike—joining us in our mission to seamlessly connect people with everyone and everything in their lives. All of this has positioned Entefy for a breakout year in 2017.
As you’re looking through, you’ll notice how we’ve done away with boxes, borders, and boundaries of all kinds—we want to emphasize the limitless potential and reach of this amazing, interconnected “smart world” we live in. Seamless interaction has always been the heart of what we do, and our new look reflects this.
If you detect hand-crafted precision in our new visual style, you have a good eye. Born from a pixel-by-pixel design process that included tireless iterations, our redesigned logo and visual theme represent an entirely new visual language for Entefy. One that embraces simplicity, efficiency, and power in this modern, hyper-connected world. You’ll see this new look on our website, on our social channels, on our team t-shirts—basically, everywhere you meet Entefy in-person or online.
On behalf of all Entefyers, we thank you for taking the time to visit our site and learn more about Entefy and the future of AI-powered digital interaction.
There are many superstitions about Friday the 13th. But whether you’re superstitious or not, the fact that 85% of tall buildings in the U.S. skip floor 13 shows most of us don’t take any chances with the number 13.
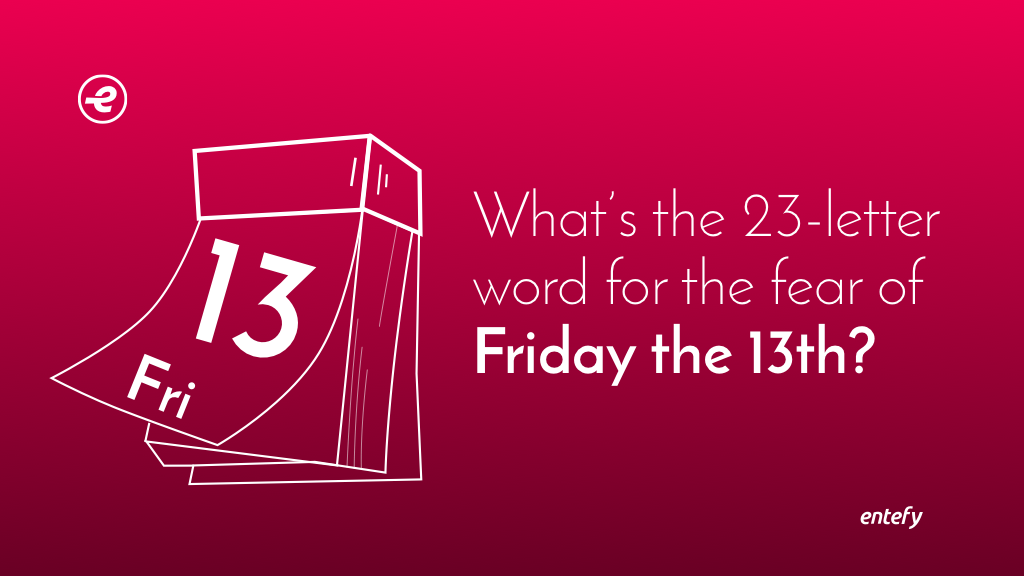
So if you’re worried about leaving the house today, we have sure-fire (and highly unscientific) cure: just say this 23-character word, “paraskevidekatriaphobia,” three time fast. What’s paraskevidekatriaphobia? That’s the fear of Friday the 13th, of course.
We came across a couple of other hard-to-pronounce terms for phobias. Did you know that “nomophobia” is the fear of being without a mobile device? Or that, ironically, the 36-character word “hippopotomonstrosesquippedaliophobia” is the fear of long words?
Assuming you weren’t struck by lightning while reading this, here are 13 more facts you might not know about Friday the 13th. Stay safe out there.
Entefy’s enFacts are illuminating nuggets of information about the intersection of communications, artificial intelligence, security and cyber privacy, and the Internet of Things. Have an idea for an enFact? We would love to hear from you.
We’ve all experienced that itch you get during those in-between moments waiting for an appointment or riding a bus. The one that has you reaching for your mobile device to flick through social media feeds in search of something mentally stimulating.
Social media feeds can be a perfect way to pass time discovering new information from sources we trust and admire. However, if we’re not careful, repeatedly revisiting those feeds is also perfectly suited to driving us into what could be called an information addiction. Because that “itch” runs on the same mental machinery that leads us to overindulge in anything, from exercise to sweets to coffee.
These compulsive behaviors are linked to the brain’s dopamine pathways. Dopamine is the neurotransmitter behind the human motivation to earn a reward. The subsequent enjoyment of the reward is actually the result of the opioid system. Together these neurotransmitters create a behavioral loop of wanting and liking: “Sweetness or other natural pleasures are mere sensations as they enter the brain, and brain systems must actively paint the pleasure onto sensation to generate a ‘liking’ reaction — as a sort of pleasure gloss or varnish.”
Here’s how it works. When your mobile device vibrates with a notification, your dopamine system sparks up as you realize there is new information available that might make you feel good, making you want to read the message. So you check your device, scan your feeds, and enjoy the feeling of being informed and up-to-date thanks to the opioid system. All of which increases the likelihood that you’ll check your device the next time it vibrates—and voila, a new behavioral loop is born.
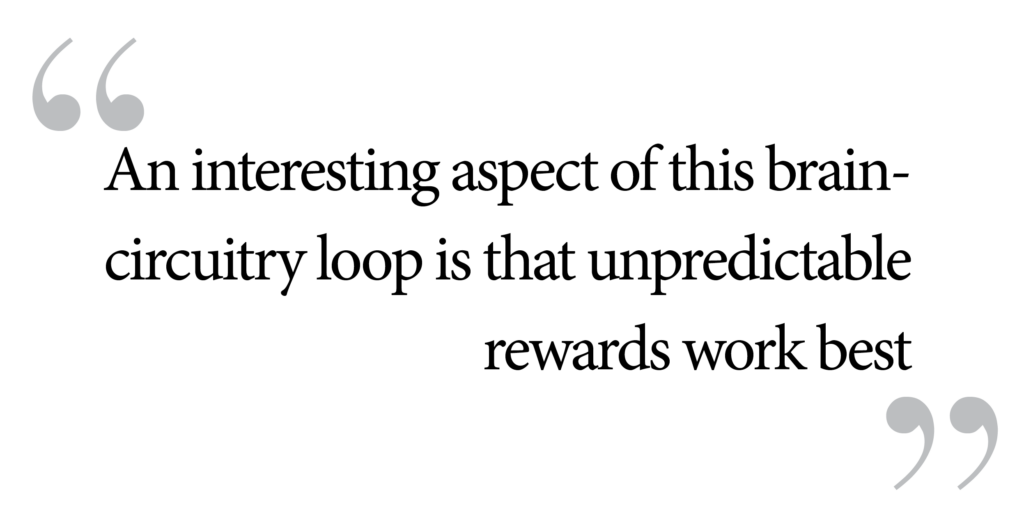
An interesting aspect of this brain-circuitry loop is that unpredictable rewards work best. That is, if you cannot be sure when you will get the reward, you will want it even more, and will overcome more “obstacles” to get it. An obstacle like listening attentively to what your friend is saying. This unpredictability aspect seems perfectly suited to social media, as you never really know when an interesting link or article or comment will come up that grabs your attention—but you know it could happen, if only you keep scrolling.
Forming a lasting impression
There is another noteworthy aspect of brain behavior related to social media: memory formation. Research suggests that low levels of focus (as is typical while browsing through social feeds) can inhibit memory formation. You may have come across this when you tried and failed to recall something you skimmed over on your feeds earlier in the day. There are ways to improve memory retention, and it starts with understanding how memories are formed. So what does it take to remember?
There are several stages to memory formation. Any experience starts out in sensory memory, which lasts for a fraction of a second and relates to what we would call perception. That lasting ring you can see when spinning a firecracker around in circles is a product of sensory memory.The final stage in memory formation is long-term memory, the holy grail of remembrance.
The second stage is short-term memory. This lasts in the range of 10-20 seconds unless we decide to focus on the memory by repeating it or using it somehow. It is often used interchangeably with working memory, although there is a slight difference in that working memory is specifically where we manipulate information. Both working and short-term memory have fairly limited capacities, able to hold approximately 5 to 9 items of information at a time.
We use the information in working memory when we try to understand the relationships and order of each item. When you add several numbers together in your head, working memory is where you hold the numbers long enough to perform the calculations. Likewise, it’s also what we use to maintain the important ideas of an article in mind long enough to understand the overall meaning of the piece.
The final stage in memory formation is long-term memory, the holy grail of remembrance. As far as we know, it can hold unlimited items for an indefinite period of time. It is here that we want important information to end up. However, for something to make it into long-term memory, it must survive the filtering processes of the aforementioned memory systems.
Humans are bombarded with sights and sounds at every moment, yet only a small fraction of our world ever makes its way to our attention, and even less is stored away for long-term use. The takeaway here is that if you want to remember something, be prepared to give it sustained attention, and then revisit it again and again to make it stick.
“People are more willing to share an article than read it. This is typical of modern information consumption. People form an opinion based on a summary, or a summary of summaries, without making the effort to go deeper.”
Research also shows that the more information we try to hold in mind at once, the poorer we are at processing all of it. This means that bouncing back and forth between unrelated information and ideas—switching from a news app to a social app then back to the news, for instance—only inhibits your brain’s natural ability to find coherence, making you more likely to forget everything. Humans are not good mental multitaskers.
If we give in to the information-seeking itch too often, and rush through feeds and links, haphazardly looking for higher and higher levels of mental stimulation and excitement, we end up overloading our working memory system and fail to record anything of substance by curiosity’s end.
Scaling it back
The good news is that moderation and sustained focus can overcome these shortcomings. It needn’t be all that difficult either: take your time reading articles that you’re particularly interested in and be more selective about what you click on or share. Think of it as increased ROI (Return on Investment) of your personal time.
Research from Kaspersky Lab discovered that when information is easy to find online, we tend not to remember the information itself, but where we found it. Basically, we’re offloading (or, more technically, “externalizing”) the memorization of facts to the Internet. This does not have to be a negative, however, as another paper shows that doing so allows us to focus better on the big-picture ideas and abstract concepts those facts pertain to, without getting overwhelmed by all the details.
What’s more, research out of UCL found that the brain increases in plasticity in response to novelty. The hippocampus is a seahorse-shaped structure in the center of the brain that is vital to forming long-term memories and is one of the first systems to break down in Alzheimer’s disease. A hippocampus more capable of changing and adapting would provide a substantial boost to learning, and it just so happens we achieve this when we’re immersed in new experiences. Of course, if the hippocampus opens its arms to novelty, the Internet sits ready to offer as much as can be grasped, and then some.
Social media is filled with novel information, formatted in such a way that it grabs our attention in the first instant or not at all. If we make more of an effort to focus on those items that do grab our attention, and not quickly jump onto the next thing, chances are we will absorb more and crave less.
Dating is a source of stress in people’s lives on par with changing jobs and holiday travel… with the in-laws. But humans crave connection, and so every night restaurants fill their tables for two with hopeful singles.
What exactly is this thing we call “dating?” Let’s get all science-y and break it down into constituent parts. It involves the evaluation of a pool of candidates, applying a set of personally meaningful factors (like appearance, personality, or profession) to select a potential match, then embarking on a complex series of communications we call “getting to know someone.”
This time- and labor-intensive process is characterized by a notoriously high failure rate. Online dating services like Match.com and eHarmony grew out of the idea that the worst parts of dating could be automated, entrusted to an algorithm that simulates the evaluation and matchmaking steps.
But how much does automation help? Are machines actually better matchmakers than we are? To answer those questions, let’s look at dating before and after the Internet, and at some of the ways advanced artificial intelligence is being developed to take automated matchmaking to a new, hands-off level.
Dating then, dating now
Before the Internet and social media, people were already outsourcing the first two steps in matchmaking, evaluation and selection. People relied on friends and family to shortcut the chaos of individual circumstances and the mysteries of human intuition. Friends set up friends on dates with people they believed would be compatible. Or two people might meet at a party or in the grocery store and get the urge to date based on a moment of intuition, short-cutting friend and family referrals entirely.
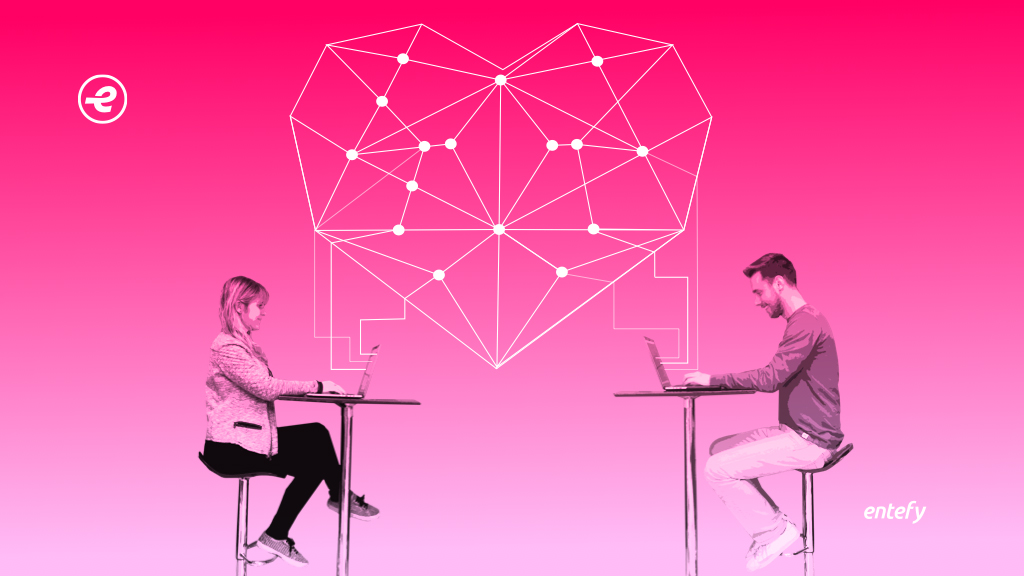
Today, online dating has become the second most popular way to meet people behind an introduction by mutual friends. Finding love is no longer defined by what’s going on in our lives, or by our networks. Serendipity and instinct aren’t as heavily relied on with the rise of online dating. People are leaning on the speed, vast pool of potential mates, and convenience of machine algorithms to find a mate.
But not all algorithms are created equal and today’s dating sites are only as good as the data they’re given. Some studies have failed to show that online algorithms work better than traditional dating methods. Some systems are built around principles that aren’t scientifically proven to be important in mate selection, like geolocation. Then there are the deliberate attempts to game the system: 22% of online daters have someone review and make changes to their profiles to improve their chances at a good match.
Amy Webb did a TED Talk about this idea that has been viewed more than 5 million times. She outsmarted the algorithm of an online dating site by deliberately catering her profile to the type of man she wanted to meet. And it worked: She went from the least popular to the most popular woman on the site, and married the man of her dreams.
The lesson here is that online dating might be more successful with more personalized data, moving past the one-size-fits all approach of many of today’s online dating sites.
Matchmaking in the age of artificial intelligence
Let’s look again at our breakdown of the dating process. Today’s leading online dating sites focus on the evaluation and selection phases, handing off a potential match at the start of the communication phase. But developments in advanced AI and predictive analysis might change that.
One of the first attempts to apply advanced AI to the communication phase of dating is known as Bernie A.I. Described as a “personal matchmaker assistant,” the mobile app works across online dating platforms to automate the evaluation and selection phases, but goes one step further by automatically messaging potential matches and handing off the match to the user only after a favorable response from the potential mate. It’s AI meets facial recognition meets automated communication.
But the future of AI in dating might be far more sophisticated. One of the shortcomings of online dating sites is honesty: 54% of online daters report that a potential match seriously misrepresented themselves on their profile. The same predictive analysis that underlies product recommendation engines could be applied to matchmaking, moving online dating beyond user-generated profiles to include data like streaming music playlists, shopping histories, and the sentiment of a person’s social shares.
As with many new implementations of artificial intelligence, like the use of AI in the classroom, the benefits of AI likely come with a trade-off: AI might reduce the stress and time dating demands, but at the loss of those leaps of human intuition that lead to better outcomes than programmatic approaches. AI is already entering the “getting to know you” phase of dating and is likely to make further inroads into completely automating matchmaking. But how much is too much? Isn’t dating as much about getting to know ourselves as it is about getting to know another person? Isn’t there value in imperfection and inefficiency?
For the time being, these questions will remain unanswered. Serendipity and technology will co-exist in the realm of dating. After all, today’s two-dimensional algorithms can’t predict how a new couple will deal with three-dimensional challenges in their future.
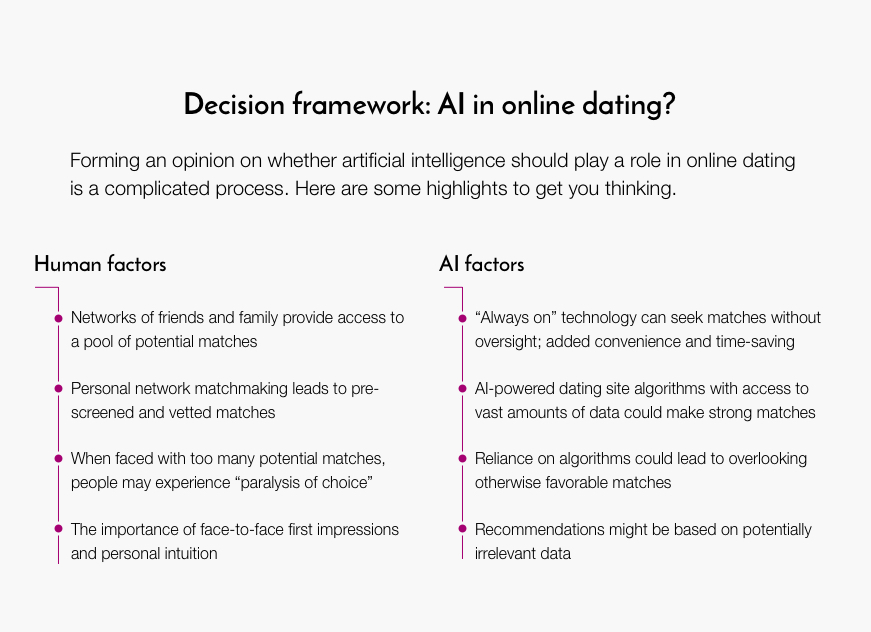
Decision framework: AI in online dating?
Forming an opinion on whether AI should play a role in online dating is a complicated process. Here are some highlights to get you thinking.
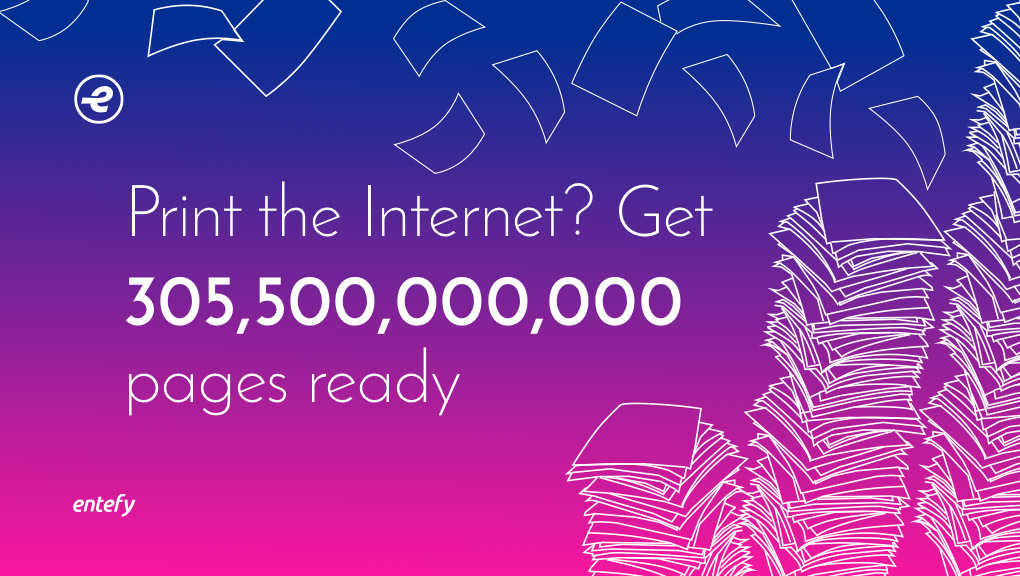
Assuming the average length of a Web page is 6.5 printed pages, then it would take 305.5 billion pages to print the Internet. This is roughly the same number of pages as 75 million copies of the seven-volume Harry Potter series.
Entefy’s enFacts are illuminating nuggets of information about the intersection of communications, artificial intelligence, security and cyber privacy, and the Internet of Things. Have an idea for an enFact? We would love to hear from you.
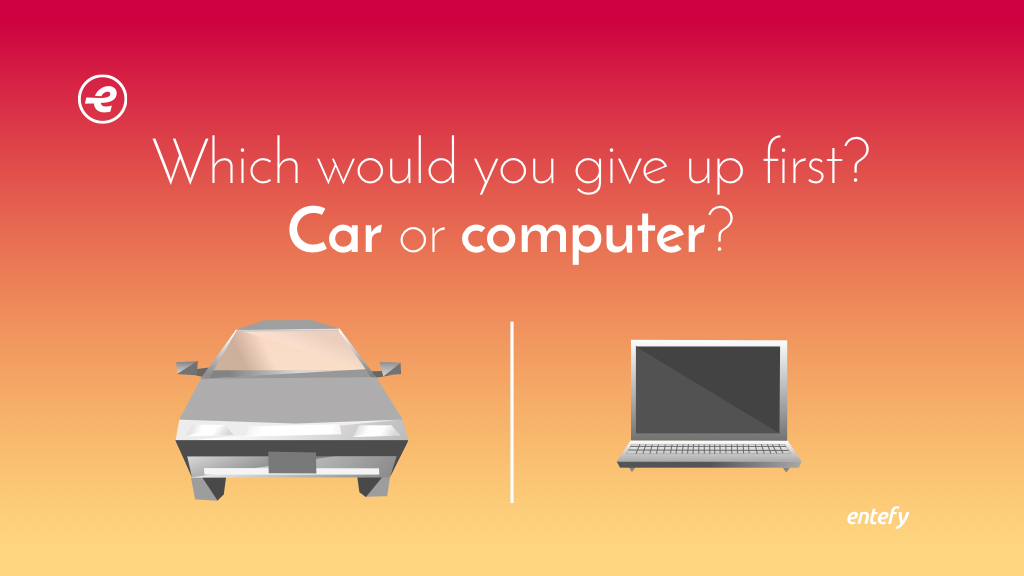
The average new car costs nearly $33,560 but people only spend fifty-five minutes driving on average, less than 4% of the day. Compared to car use, people spend nearly twice as much time during the day using their smartphones and nearly 12 times as much time on computers, tablets, and other digital devices (10 hours and 39 minutes).
Cars can take you down new roads to discover new sights, while your smartphone helps you navigate the rapidly expanding digital universe. If you had to make a choice, which would you give up first: your car or your computer? In a previous enFact, we asked that same question about your smartphone or fridge.
Entefy’s enFacts are illuminating nuggets of information about the intersection of communications, artificial intelligence, security and cyber privacy, and the Internet of Things. Have an idea for an enFact? We would love to hear from you.
What is digital complexity, and how does it affect everyday interactions? Over the past decade, people have integrated so much technology into their lives that we felt it was time to take a closer look at how our attitudes and behaviors are changing.
Earlier this year, Entefy conducted a survey of 1,500 professionals in the U.S. working in four primary business categories—Healthcare, Technology, Financial Services, and Legal—with additional participants in Retail, Education, and Manufacturing. We were interested in the views of those who are working in the most dynamic professional environments.
What we found were surprising insights into the digital complexity and app overload that so many professionals wrestle with every day. This research report presents our findings about the digital ecosystems of people working in complex, demanding, and challenging parts of the economy.
BACKGROUND
Entefy is introducing an intelligent communication platform that seamlessly connects the people, services, and smart things in your digital life. All your conversations (emails, texts, calls, video messages), contacts, files, apps, and smart devices are made accessible and functional through a single interface running on your favorite devices. We call this platform a universal communicator, representing first-of-its-kind software that provides all-in-one, AI-powered digital communication.
In this report, we describe the unique combination of computing devices, mobile apps, and desktop applications that people use to manage their digital ecosystems. This report will present revealing data outlining the size and makeup of these ecosystems.
SURVEY METHODOLOGY
The goal of this survey was to understand the needs of professional workers in the U.S. based on their digital activity, including usage of devices and applications. We wanted to learn:
Just how many devices and applications people routinely use?
How many messages are people exchanging with one another?
Does the current state of technology create complexity for busy workers?
What percentage of people care about simplifying their digital lives?
Using an independent third party, we surveyed 1,500 adults, evenly distributed in age range from 18 to 65, and geographically distributed across the U.S. in small and large cities alike. Survey respondents were screened to meet quotas for working in four specific areas— Healthcare, Technology, Financial Services, and Legal.
FINDINGS & INSIGHTS
People are living increasingly active digital lives characterized by the use of multiple devices, applications, and services. As we look at each of the survey’s core findings, a new picture emerges, illustrating the digital complexity and information overload faced by busy professionals.
Entefy’s 2016 survey indicates a bi-modal distribution of interest in a universal communicator that simplifies communication and interaction in today’s digital world. 93% of survey respondents who self-identified as being technical novices and 78% of technical experts were “Very Interested” in a universal communicator.
Early adopters
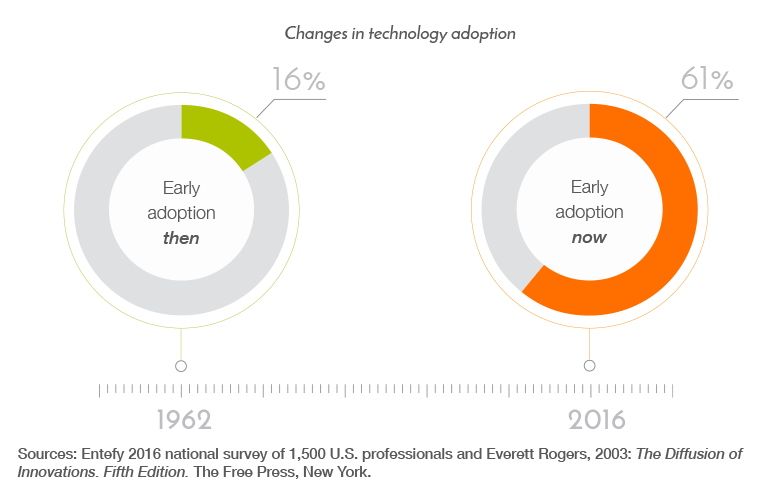
We start with technology adoption. Everett Rogers in Diffusion of Innovations concluded that 16% of the U.S. population are first or early adopters. Since publishing his findings in 1962, however, behaviors have changed dramatically. In 2016, when we asked our respondents about their approach to technology, we found that 61% self-identified as either first or early adopters of new technology.
Digital device use
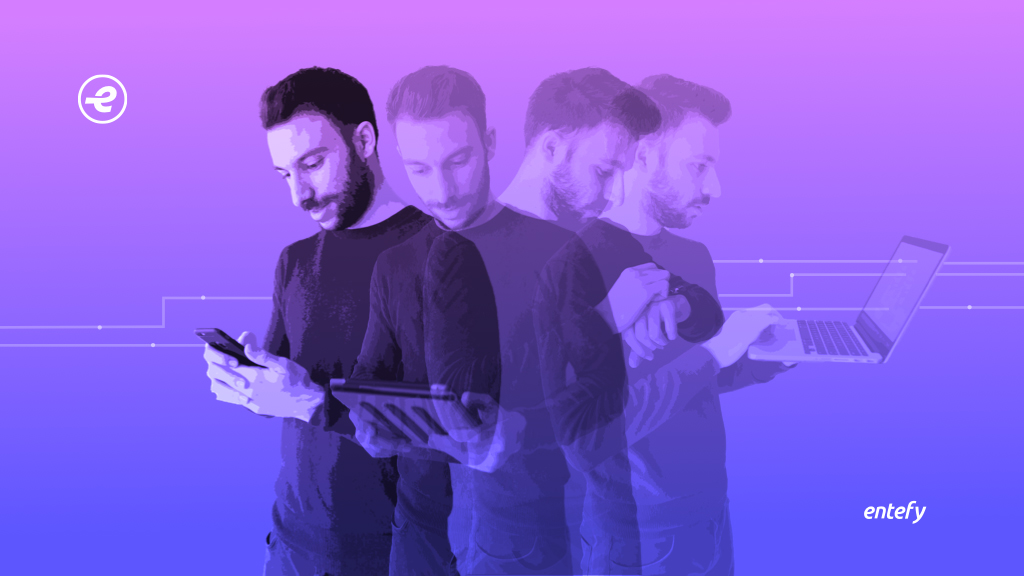
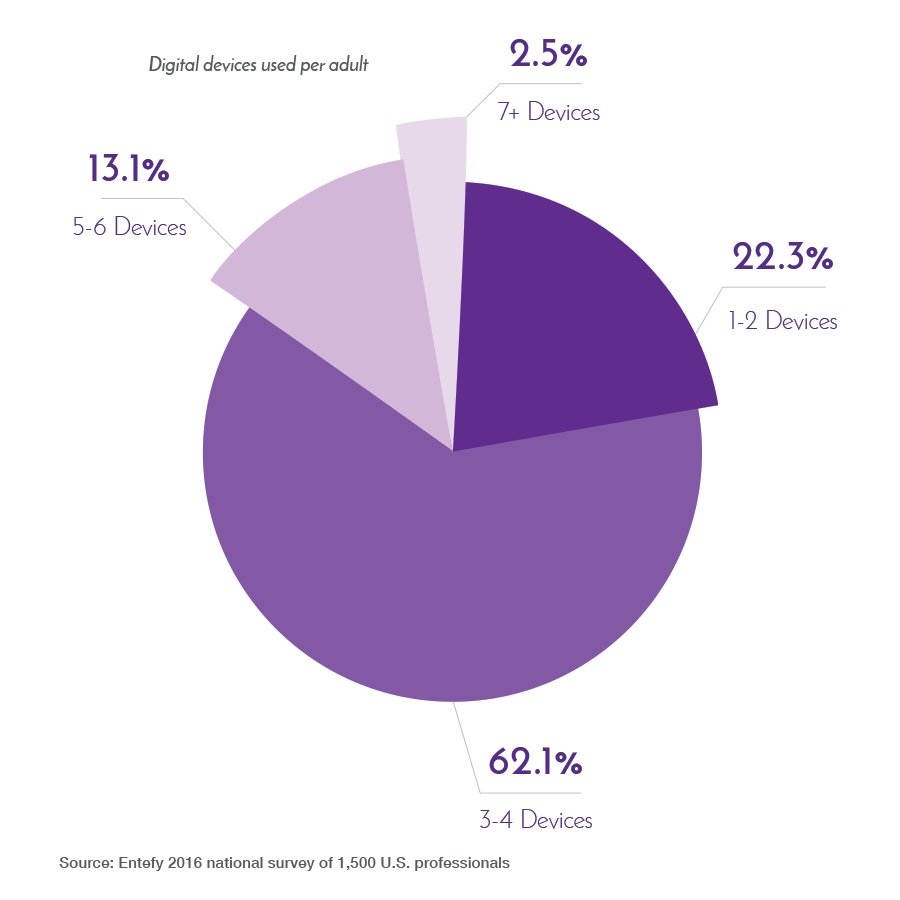
Our respondents operate in technology-intense environments and the survey provided specifics as to exactly what that intensity means. On average, respondents make use of 3.4 devices (computers, laptops, tablets, smartphones, etc.) with 62% of those who completed the survey using between 3 and 4 technology devices. At the extremes, 2.7% of respondents have 1 device and 5.3% have 6 or more. 1.3% of people have more than 8.
Communication apps
Not only are people using multiple devices but they are using an array of digital communication applications, each with its own protocols, learning curve, and quirks. Our respondents use an average of 6.9 communication applications to stay in touch with business colleagues, clients, friends, and family.
Part of the reason for the high number of digital communication applications is environmental. That is, many professionals maintain a technologically diverse network of contacts. Platforms such as instant messaging, texting, emailing, and video- calling each appeal to particular demographics for particular purposes. Because there is not currently a single app that allows communication across all of these channels, people are forced to curate their own personal digital ecosystems. And all those apps and applications add up, and create complexity.
Geography and adoption
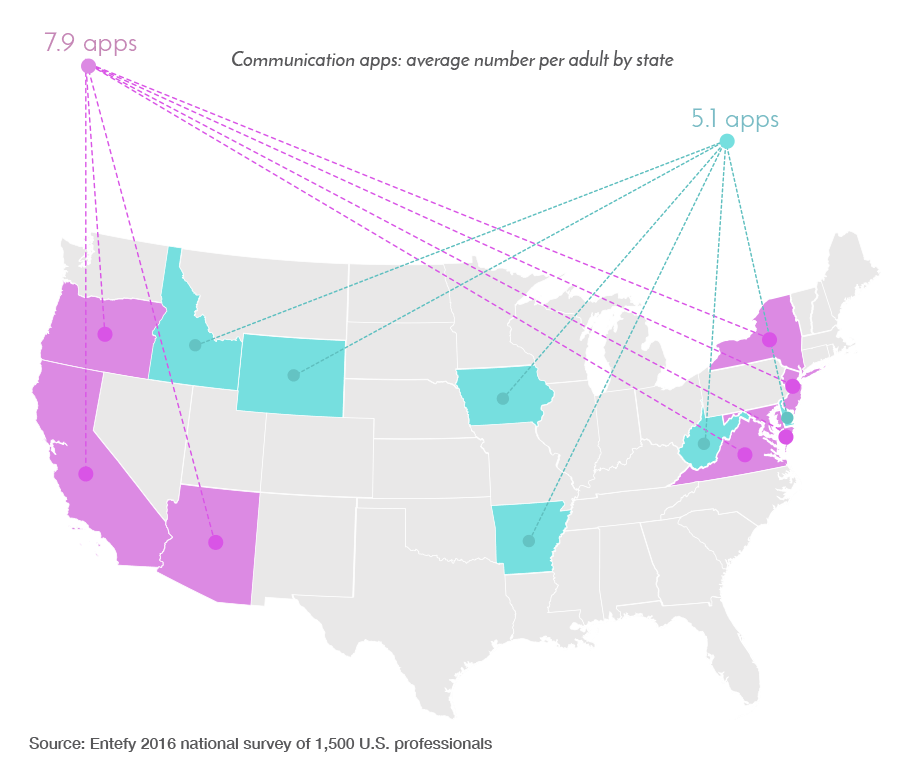
The number of communication applications survey respondents use is closely linked to the state in which they live and work. For example, states with smaller populations, lower density, and less diverse economies (such as Arkansas, Delaware, Idaho, Iowa, Wyoming, and West Virginia) use relatively fewer communication applications. The average for these states is 5.1 communication applications per respondent.
On the other hand, states with larger populations and a higher number of large cities, greater economic diversity, and established technology industries (such as Arizona, California, Maryland, New Jersey, New York, Oregon, and Virginia) tend to use more digital communication applications. The average for these states is 7.9 communication applications per respondent. These states also have a higher proportion of “First” and “Early Adopters.”
Messaging volume
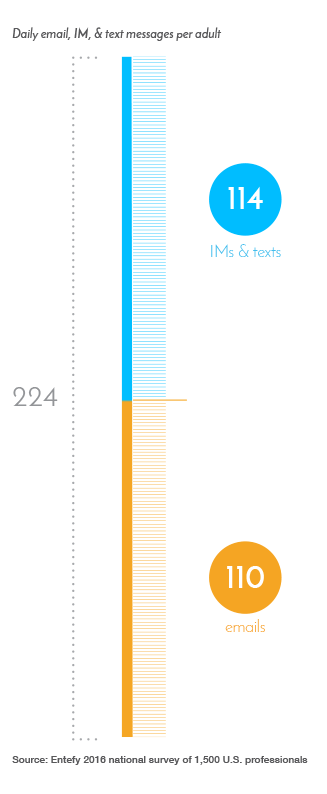
Intense technology environments also translate into high-volume digital communication. Our average respondent sends and receives 110 emails and 114 instant messages and texts per day. Of the emails sent each day by our participants, 60% of them are work related.
Looking at the figures in terms of time, our respondents send and receive 14 messages per waking hour, using 7.9 digital communication applications (excluding social media) on 3.4 devices.
Social media platforms
The complexity of a person’s digital communication environment cannot be assessed solely by counting emails and text messages—not when social media use is so prevalent. We asked our respondents about different social media platforms and the extent to which they used each of them.
Here are some highlights:
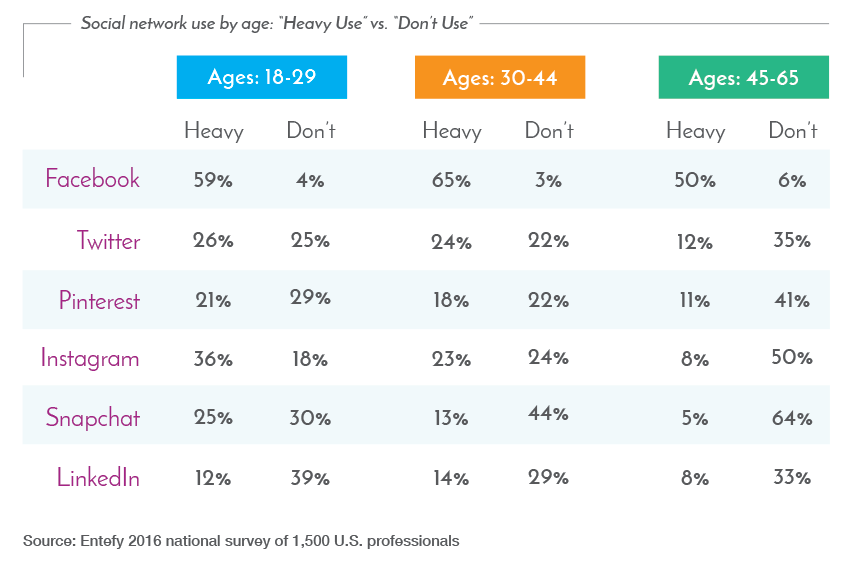
65% of survey respondents in the “30 to 44” age group indicated “Heavy” use of Facebook, ahead of the other two age groups, “18 to 29” and “45 to 65.”
The “18 to 29” age group made “Heavy” use of Facebook (59%), Instagram (36%), Twitter (26%), and Snapchat (25%) ahead of the other social networks.
Across all age groups, nearly 1/3 of survey respondents selected “Don’t Use” for LinkedIn.
Other than Facebook, the “45 to 65” age group had relatively high “Don’t Use” percentages for Twitter, Pinterest, Instagram, Snapchat, and LinkedIn.
As the data relates to the universal communicator, “Heavy” users of social networks expressed high interest, with 70.6% to 82.4% of those survey respondents indicated they were “Very Interested.”
Preferences in adopting new technologies
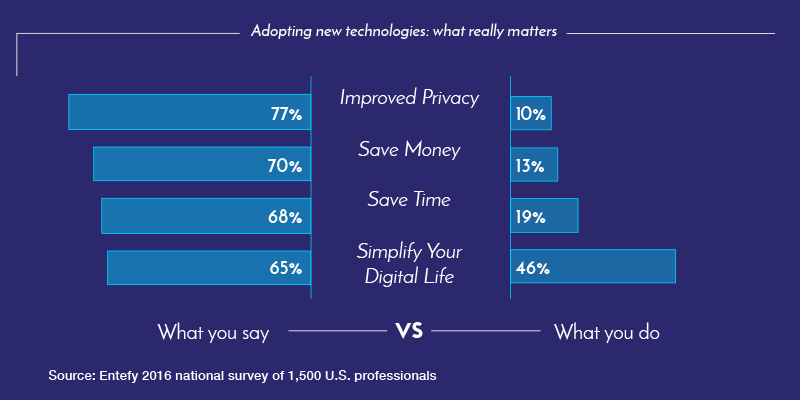
This one was surprising. When considering whether to adopt a new technology, what people say they look for is often quite different from what ultimately drives the adoption decision.
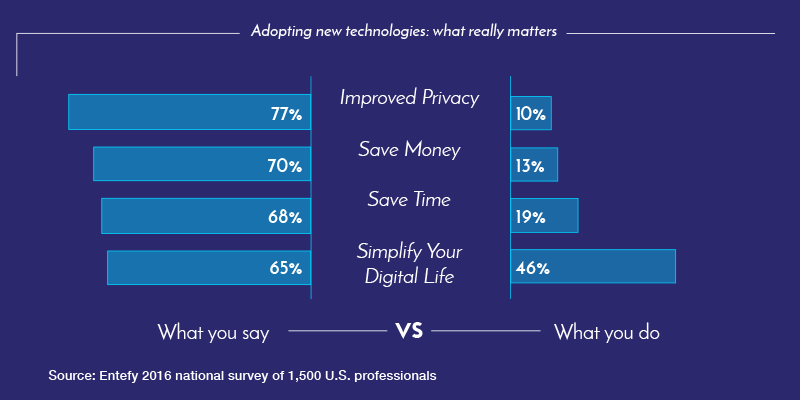
When respondents were asked about the most important considerations for future technology acquisitions, they indicated that among the most important considerations were “Improved Privacy” (77%), “Save Money” (70%), “Save Time” (68%), and “Simplify Your Digital Life” (65%).
However, when we asked about the most important factors influencing decisions they had already made, such as acquiring e-mail applications or cloud storage services, their priorities were nearly the opposite of those stated above. In making decisions about past acquisitions, the priorities were: “Simplify Your Digital Life” (46%), “Save Time” (19%), “Improved Privacy” (13%), “Save Money” (10%).
Simplification cation was clearly the dominant consideration when respondents made actual technology decisions. In fact, simplification cation was 3.5 times as great a factor in their decision- making as saving money. It is not uncommon for stated priorities to differ from actual priorities in decision-making, but this complete inversion is noteworthy.
The value of simplification in our study is consistent with another independent set of research. The branding firm Siegel & Gale, member of Omnicom, a global marketing and communications company, has researched the linkage between simplicity of brand messaging and actual stock market performance. This research has led to their Global Brand Simplicity Index, which indicates that companies with the simplest brands outperform complex brands by more than 3 times. Whether you’re talking technology choices or brand performance, simplification plays a key role in decision-making.
Mobile apps we “can’t live without”
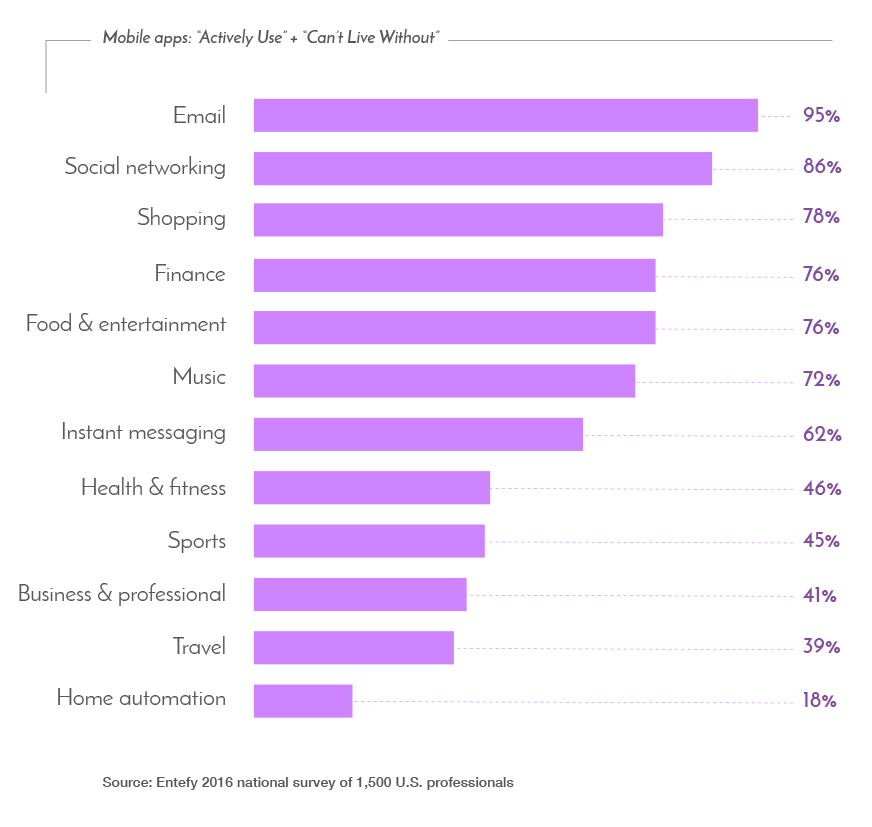
We asked: Which mobile apps do you actively use? The response options were “Don’t Use,” “Rarely Use,” “Actively Use,” and “Can’t Live Without.” At the very top of the activity scale was email, which 95% of survey respondents said they “Actively Use” or “Can’t Live Without.” To us, this indicates the ubiquitous nature of email as a digital communication medium on mobile devices.
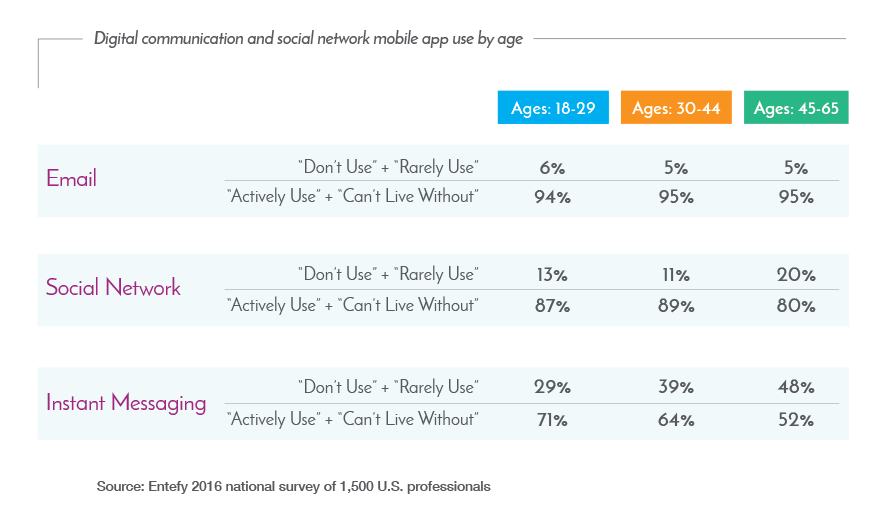
Drilling down further, we asked survey respondents about their needs across a range of digital communication and social network mobile apps.
Email use is consistent across age groups
Social networks trail email use only slightly, and remain relatively popular across all age groups
Instant messaging: “Actively Use” and “Can’t Live Without” percentages decline with age
CONCLUSION
What happens when we connect the dots of the individual survey sections? Interesting insights emerge.
Communication apps are core to the average person’s digital ecosystem, something that our survey respondents “Actively Use” or “Can’t Live Without.” We are all using multiple apps to connect and interact with each other.
The next insight from the data was the importance of simplification in our increasingly complex digital world. On average, our survey respondents use 3.4 devices and 6.9 communication apps (11.2 including social media apps). In practice, that’s a lot of hopping in and out of apps to manage basic communication and interaction. This is one face of digital complexity—and it’s no wonder simplification is so important to so many people.
This desire to simplify connects directly to high interest in a universal communicator among survey respondents. An astonishing 95% were “Very Interested” or “Somewhat Interested.”
Put simply: The more complex your digital life, the more complex your digital ecosystem. And the more complex your digital ecosystem, the greater the need for core technology designed to reduce complexity.
ABOUT ENTEFY
At Entefy, we’re introducing the first universal communicator–a smart platform that uses advanced artificial intelligence to help you seamlessly interact with the people, services, and smart things in your life–all from a single application that runs beautifully across your favorite devices.
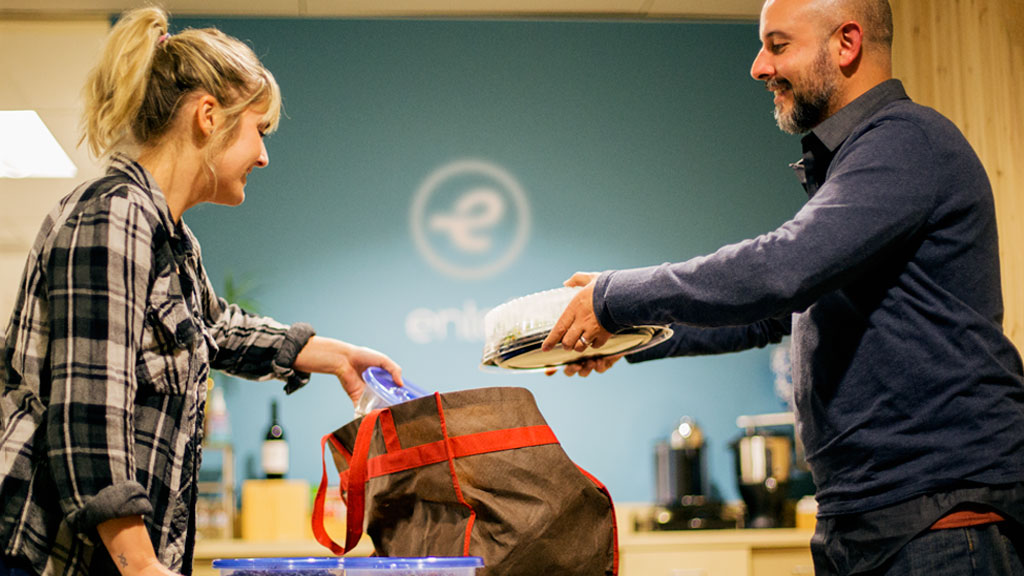
No two days at Entefy are ever the same. At any given moment, we might have partners, investors, or advisors stopping in for a visit, potential candidates interviewing…the list goes on.
What does remain constant, though, is our appreciation for everyone who takes the time to visit our office. One way we show gratitude and camaraderie is through food. We always make sure there are plenty of snacks, lunch, and drinks for all, and offer food and beverages whenever someone walks in the door.
Because the number of people in our office fluctuates, we sometimes end up with extra food. That made us think about wasting food, which research shows is a major problem around the country:
Getting food from the farm to our fork eats up 10 percent of the total U.S. energy budget, uses 50 percent of U.S. land, and swallows 80 percent of all freshwater consumed in the United States. Yet, 40 percent of food in the United States today goes uneaten.
So we try to do our part by donating to a local organization called LifeMoves, which is committed to creating housing opportunities for homeless individuals and families. In fact, “more than 92% of families and 78% of individuals completing LifeMoves transitional programs successfully returned to stable housing and self-sufficiency.” We are big fans of impact, not just in technology or business, but in supporting people whenever possible.
So, when we have extra food, we pack it all up and drive it over there. We know our modest contribution can’t feed everyone, but as the old adage goes, every bit counts.
In two generations, our relationship with phones has changed dramatically. In 1945, few people had a phone, and those who did used it less than once a day. By 1950 but still did not use it much more than once a day on average. The number of homes with a telephone grew to 99% in 2000.
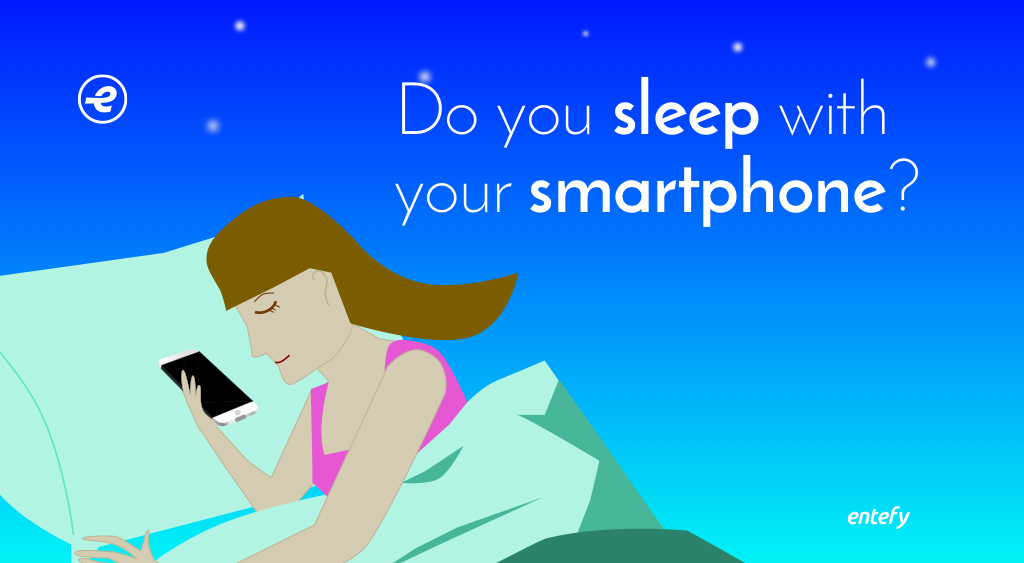
Today, virtually everyone has a phone. 92% of us have cellphones and 68% use a smartphone, and not just for conversations but for texts, searches, news, etc. One study shows that “approximately three-quarters (71%) of respondents are sleeping with—or next to—their mobile phones.”
Entefy’s enFacts are illuminating nuggets of information about the intersection of communications, artificial intelligence, security and cyber privacy, and the Internet of Things. Have an idea for an enFact? We would love to hear from you.
Request a Demo
Is your organization pursuing an AI-first transformation strategy? If so, start the conversation by submitting the form below.
Contact Us
Thank you for your interest in Entefy. You can contact us using the form below.
Download Data Sheets
See our Privacy Statement to learn more about how we use cookies on our website and how to change cookies settings if you do not want cookies on your computer. By using this site you consent to our use of cookies in accordance with our Privacy Statement.