INTRODUCTION
What is digital complexity, and how does it affect everyday interactions? Over the past decade, people have integrated so much technology into their lives that we felt it was time to take a closer look at how our attitudes and behaviors are changing.

Earlier this year, Entefy conducted a survey of 1,500 professionals in the U.S. working in four primary business categories—Healthcare, Technology, Financial Services, and Legal—with additional participants in Retail, Education, and Manufacturing. We were interested in the views of those who are working in the most dynamic professional environments.
What we found were surprising insights into the digital complexity and app overload that so many professionals wrestle with every day. This research report presents our findings about the digital ecosystems of people working in complex, demanding, and challenging parts of the economy.
BACKGROUND
Entefy is introducing an intelligent communication platform that seamlessly connects the people, services, and smart things in your digital life. All your conversations (emails, texts, calls, video messages), contacts, files, apps, and smart devices are made accessible and functional through a single interface running on your favorite devices. We call this platform a universal communicator, representing first-of-its-kind software that provides all-in-one, AI-powered digital communication.
In this report, we describe the unique combination of computing devices, mobile apps, and desktop applications that people use to manage their digital ecosystems. This report will present revealing data outlining the size and makeup of these ecosystems.
SURVEY METHODOLOGY
The goal of this survey was to understand the needs of professional workers in the U.S. based on their digital activity, including usage of devices and applications. We wanted to learn:
- Just how many devices and applications people routinely use?
- How many messages are people exchanging with one another?
- Does the current state of technology create complexity for busy workers?
- What percentage of people care about simplifying their digital lives?
Using an independent third party, we surveyed 1,500 adults, evenly distributed in age range from 18 to 65, and geographically distributed across the U.S. in small and large cities alike. Survey respondents were screened to meet quotas for working in four specific areas— Healthcare, Technology, Financial Services, and Legal.
FINDINGS & INSIGHTS
People are living increasingly active digital lives characterized by the use of multiple devices, applications, and services. As we look at each of the survey’s core findings, a new picture emerges, illustrating the digital complexity and information overload faced by busy professionals.
Entefy’s 2016 survey indicates a bi-modal distribution of interest in a universal communicator that simplifies communication and interaction in today’s digital world. 93% of survey respondents who self-identified as being technical novices and 78% of technical experts were “Very Interested” in a universal communicator.
Early adopters
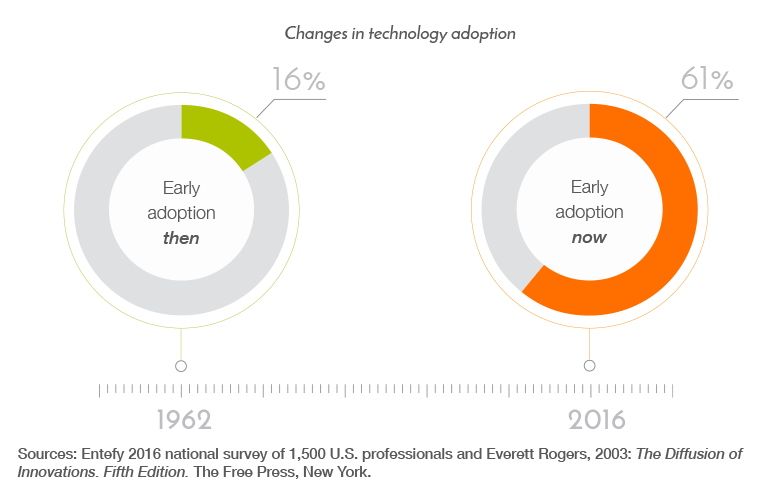
We start with technology adoption. Everett Rogers in Diffusion of Innovations concluded that 16% of the U.S. population are first or early adopters. Since publishing his findings in 1962, however, behaviors have changed dramatically. In 2016, when we asked our respondents about their approach to technology, we found that 61% self-identified as either first or early adopters of new technology.
Digital device use
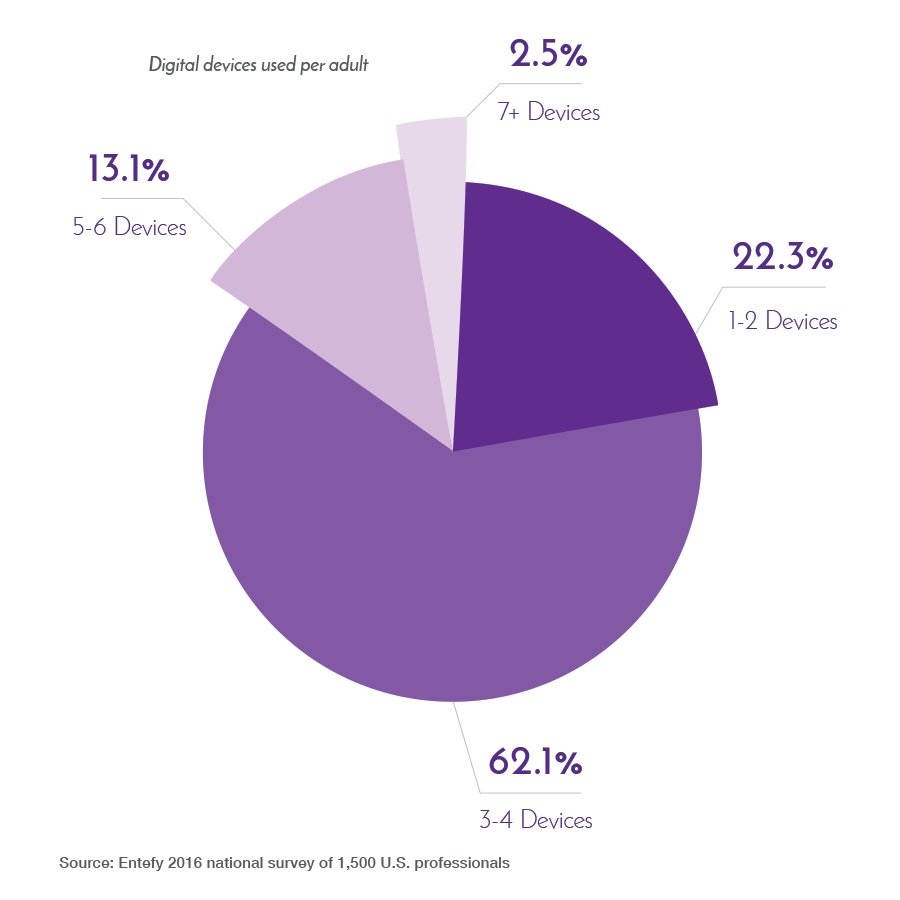
Our respondents operate in technology-intense environments and the survey provided specifics as to exactly what that intensity means. On average, respondents make use of 3.4 devices (computers, laptops, tablets, smartphones, etc.) with 62% of those who completed the survey using between 3 and 4 technology devices. At the extremes, 2.7% of respondents have 1 device and 5.3% have 6 or more. 1.3% of people have more than 8.
Communication apps
Not only are people using multiple devices but they are using an array of digital communication applications, each with its own protocols, learning curve, and quirks. Our respondents use an average of 6.9 communication applications to stay in touch with business colleagues, clients, friends, and family.
Part of the reason for the high number of digital communication applications is environmental. That is, many professionals maintain a technologically diverse network of contacts. Platforms such as instant messaging, texting, emailing, and video- calling each appeal to particular demographics for particular purposes. Because there is not currently a single app that allows communication across all of these channels, people are forced to curate their own personal digital ecosystems. And all those apps and applications add up, and create complexity.
Geography and adoption
The number of communication applications survey respondents use is closely linked to the state in which they live and work. For example, states with smaller populations, lower density, and less diverse economies (such as Arkansas, Delaware, Idaho, Iowa, Wyoming, and West Virginia) use relatively fewer communication applications. The average for these states is 5.1 communication applications per respondent.
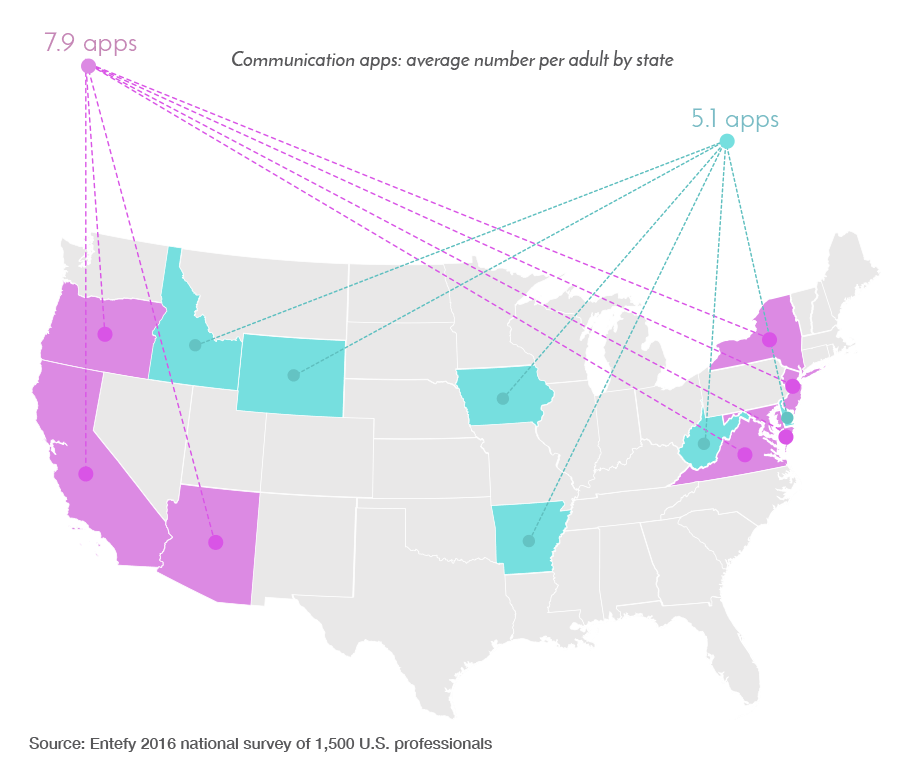
On the other hand, states with larger populations and a higher number of large cities, greater economic diversity, and established technology industries (such as Arizona, California, Maryland, New Jersey, New York, Oregon, and Virginia) tend to use more digital communication applications. The average for these states is 7.9 communication applications per respondent. These states also have a higher proportion of “First” and “Early Adopters.”
Messaging volume
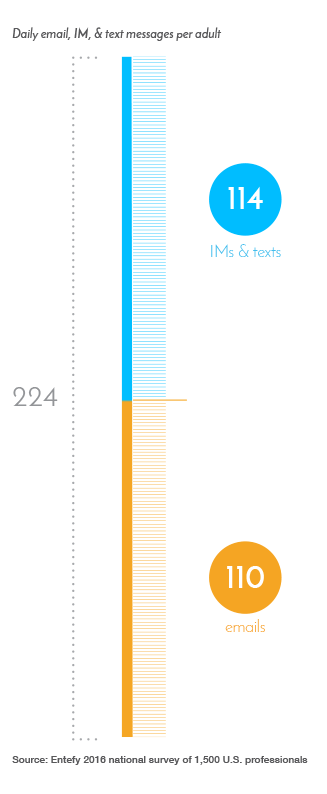
Intense technology environments also translate into high-volume digital communication. Our average respondent sends and receives 110 emails and 114 instant messages and texts per day. Of the emails sent each day by our participants, 60% of them are work related.
Looking at the figures in terms of time, our respondents send and receive 14 messages per waking hour, using 7.9 digital communication applications (excluding social media) on 3.4 devices.
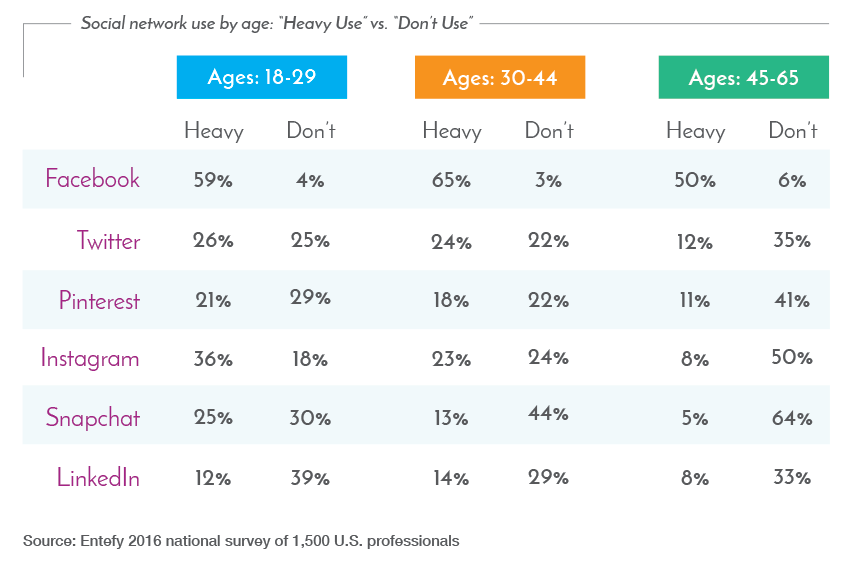
Social media platforms
The complexity of a person’s digital communication environment cannot be assessed solely by counting emails and text messages—not when social media use is so prevalent. We asked our respondents about different social media platforms and the extent to which they used each of them.
Here are some highlights:
- 65% of survey respondents in the “30 to 44” age group indicated “Heavy” use of Facebook, ahead of the other two age groups, “18 to 29” and “45 to 65.”
- The “18 to 29” age group made “Heavy” use of Facebook (59%), Instagram (36%), Twitter (26%), and Snapchat (25%) ahead of the other social networks.
- Across all age groups, nearly 1/3 of survey respondents selected “Don’t Use” for LinkedIn.
- Other than Facebook, the “45 to 65” age group had relatively high “Don’t Use” percentages for Twitter, Pinterest, Instagram, Snapchat, and LinkedIn.
As the data relates to the universal communicator, “Heavy” users of social networks expressed high interest, with 70.6% to 82.4% of those survey respondents indicated they were “Very Interested.”
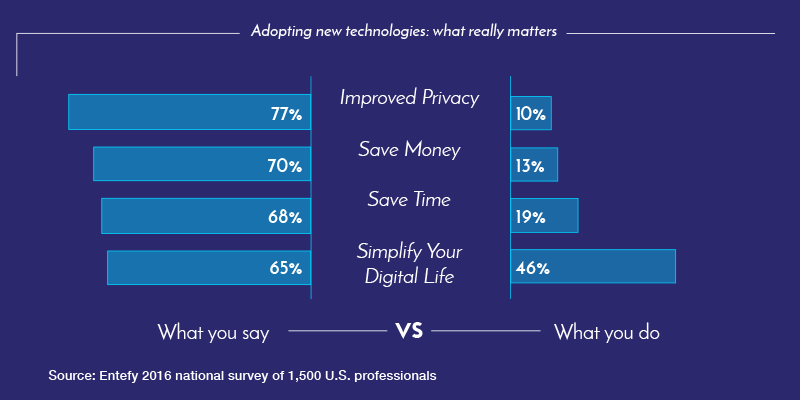
Preferences in adopting new technologies
This one was surprising. When considering whether to adopt a new technology, what people say they look for is often quite different from what ultimately drives the adoption decision.
When respondents were asked about the most important considerations for future technology acquisitions, they indicated that among the most important considerations were “Improved Privacy” (77%), “Save Money” (70%), “Save Time” (68%), and “Simplify Your Digital Life” (65%).

However, when we asked about the most important factors influencing decisions they had already made, such as acquiring e-mail applications or cloud storage services, their priorities were nearly the opposite of those stated above. In making decisions about past acquisitions, the priorities were: “Simplify Your Digital Life” (46%), “Save Time” (19%), “Improved Privacy” (13%), “Save Money” (10%).
Simplification cation was clearly the dominant consideration when respondents made actual technology decisions. In fact, simplification cation was 3.5 times as great a factor in their decision- making as saving money. It is not uncommon for stated priorities to differ from actual priorities in decision-making, but this complete inversion is noteworthy.
The value of simplification in our study is consistent with another independent set of research. The branding firm Siegel & Gale, member of Omnicom, a global marketing and communications company, has researched the linkage between simplicity of brand messaging and actual stock market performance. This research has led to their Global Brand Simplicity Index, which indicates that companies with the simplest brands outperform complex brands by more than 3 times. Whether you’re talking technology choices or brand performance, simplification plays a key role in decision-making.
Mobile apps we “can’t live without”
We asked: Which mobile apps do you actively use? The response options were “Don’t Use,” “Rarely Use,” “Actively Use,” and “Can’t Live Without.” At the very top of the activity scale was email, which 95% of survey respondents said they “Actively Use” or “Can’t Live Without.” To us, this indicates the ubiquitous nature of email as a digital communication medium on mobile devices.
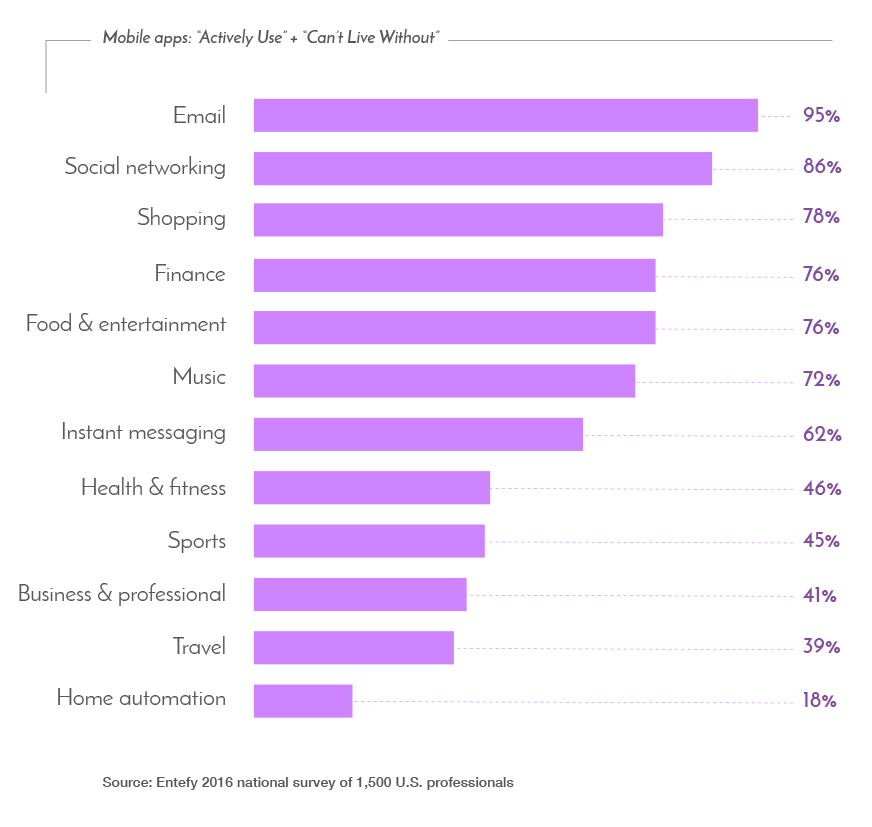
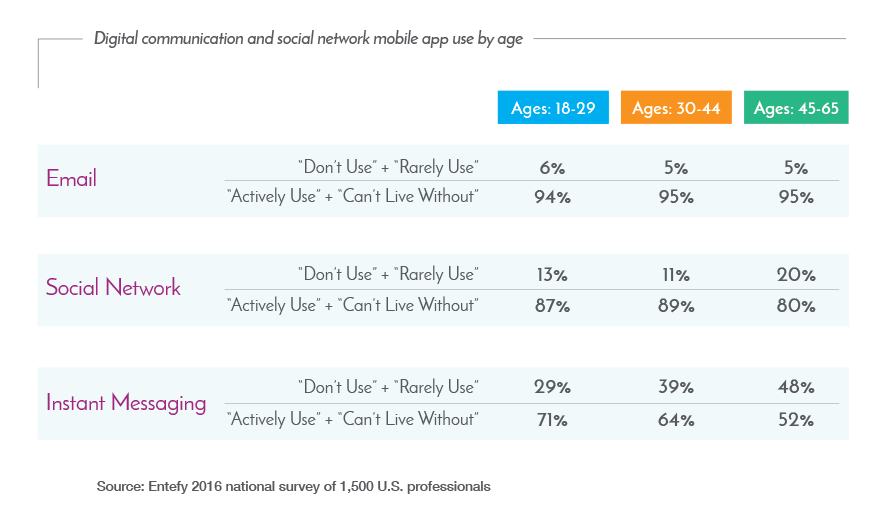
Drilling down further, we asked survey respondents about their needs across a range of digital communication and social network mobile apps.
- Email use is consistent across age groups
- Social networks trail email use only slightly, and remain relatively popular across all age groups
- Instant messaging: “Actively Use” and “Can’t Live Without” percentages decline with age
CONCLUSION
What happens when we connect the dots of the individual survey sections? Interesting insights emerge.
Communication apps are core to the average person’s digital ecosystem, something that our survey respondents “Actively Use” or “Can’t Live Without.” We are all using multiple apps to connect and interact with each other.
The next insight from the data was the importance of simplification in our increasingly complex digital world. On average, our survey respondents use 3.4 devices and 6.9 communication apps (11.2 including social media apps). In practice, that’s a lot of hopping in and out of apps to manage basic communication and interaction. This is one face of digital complexity—and it’s no wonder simplification is so important to so many people.
This desire to simplify connects directly to high interest in a universal communicator among survey respondents. An astonishing 95% were “Very Interested” or “Somewhat Interested.”
Put simply: The more complex your digital life, the more complex your digital ecosystem. And the more complex your digital ecosystem, the greater the need for core technology designed to reduce complexity.
ABOUT ENTEFY
At Entefy, we’re introducing the first universal communicator–a smart platform that uses advanced artificial intelligence to help you seamlessly interact with the people, services, and smart things in your life–all from a single application that runs beautifully across your favorite devices.